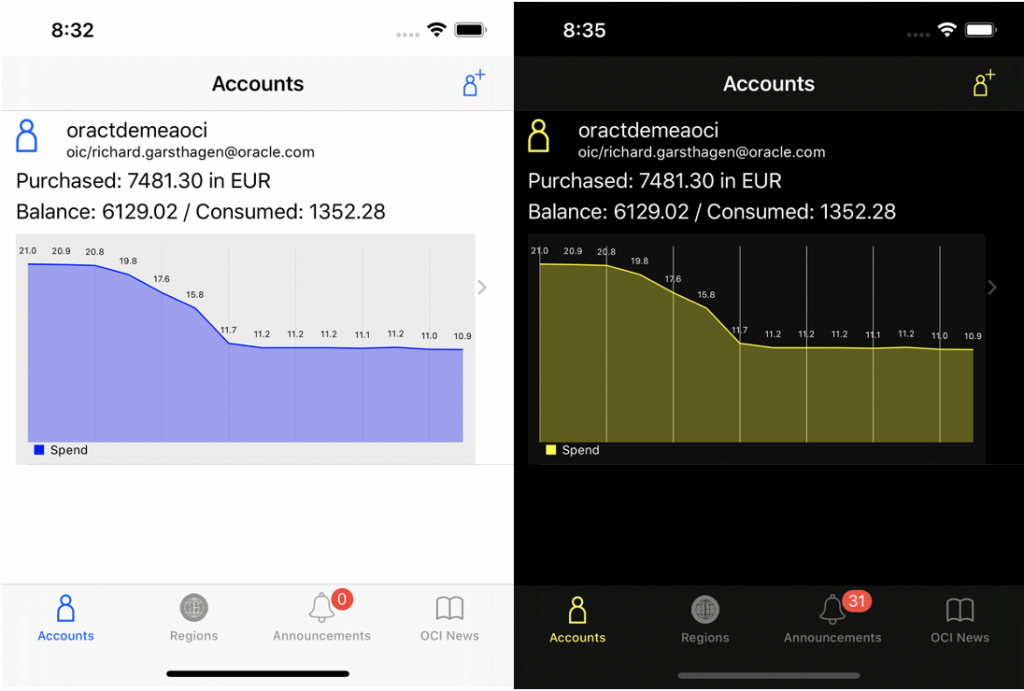
Who does not like pretty charts 😉 Well the OCI Manager App for iphones now shows your last 14 days of consumption in a “pretty” chart. Ok, I am still a bit of an amateur developer, to the charts are not pretty yet, but it is a start. Took me some time to figure out how to place and update charts in a UITableViewCell, but that is sorted now. This will also open the door that I will try to add the performance metrics of the resources in the app.
OCI Manager App Features
If you were not yet familiar with the OCI Manager App, here an overview of some of the features:
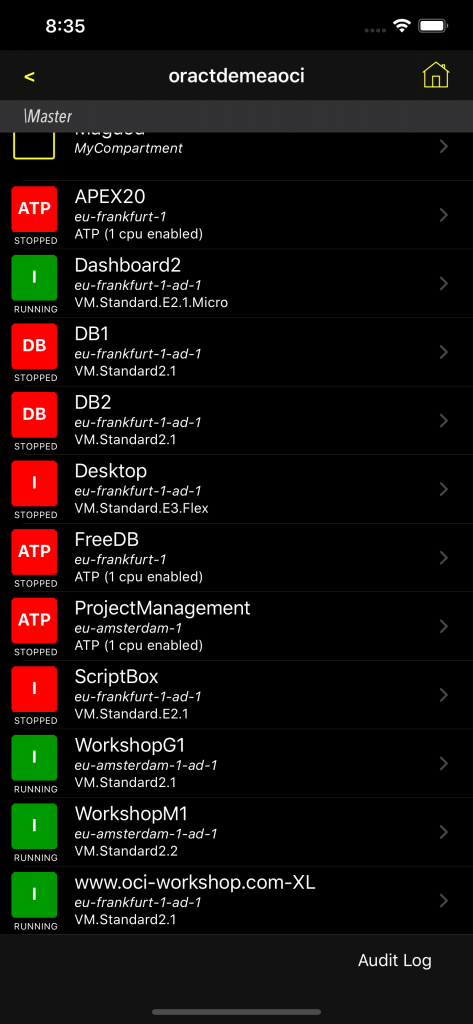
- See all you compute and database resources across all regions per compartment
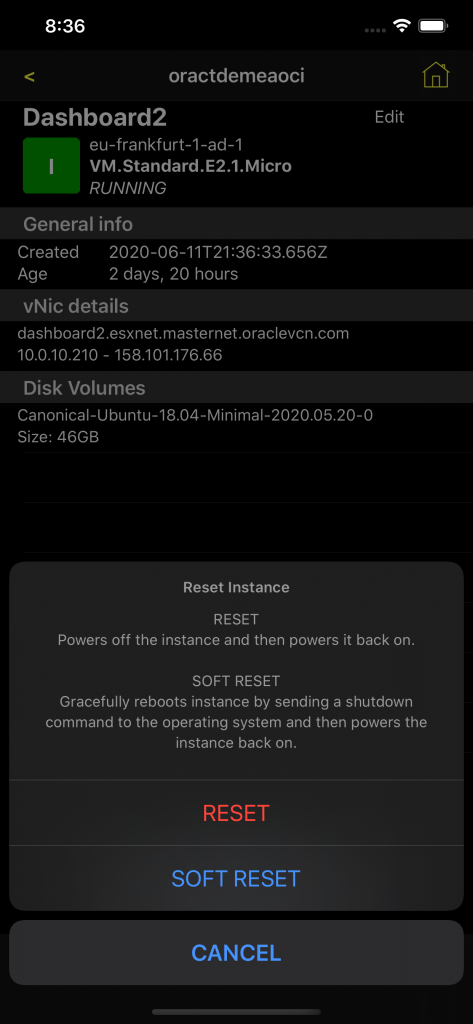
- Interact with your resources; Power On/Off, Hard and Soft Reboot, Scale Up/Down of resources
- Multi Account / Tenancy support
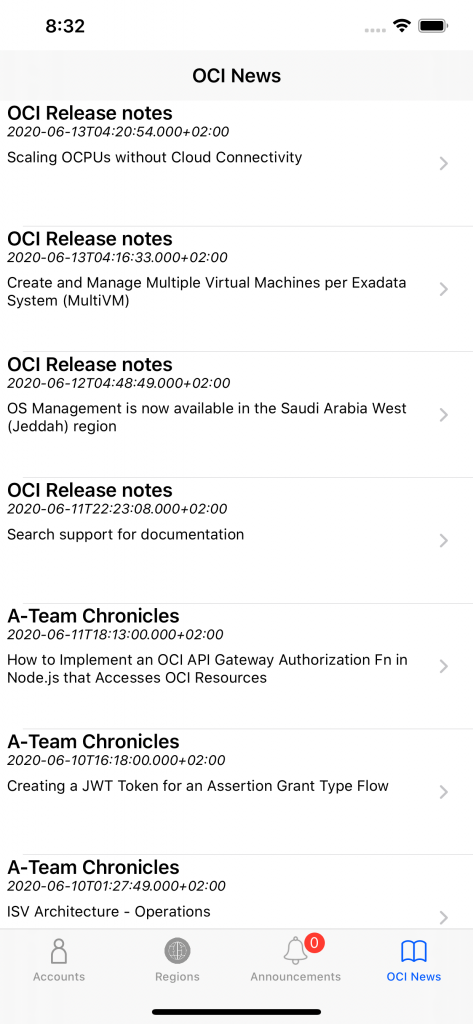
- See all the latest OCI Announcements in your tenancies
- Read all the latest news around OCI from various blogs and the official Oracle Channels
- See the console output of your linux instances
- See consumption data for each tenancy
You can find more information about how to get and configure the App here:
https://oc-blog.com/iphone/
Hello my friend, using this last post to congratulate and thank you for all this content that is being available…
I’m having my first contacts with OCI since may and i’ll do Architect tests during this week. Any tips for those last days before I start the certification test?
I would recommend to do the practice exam and read some of the documentation for the services your are least familiar with. Good luck with the exam!