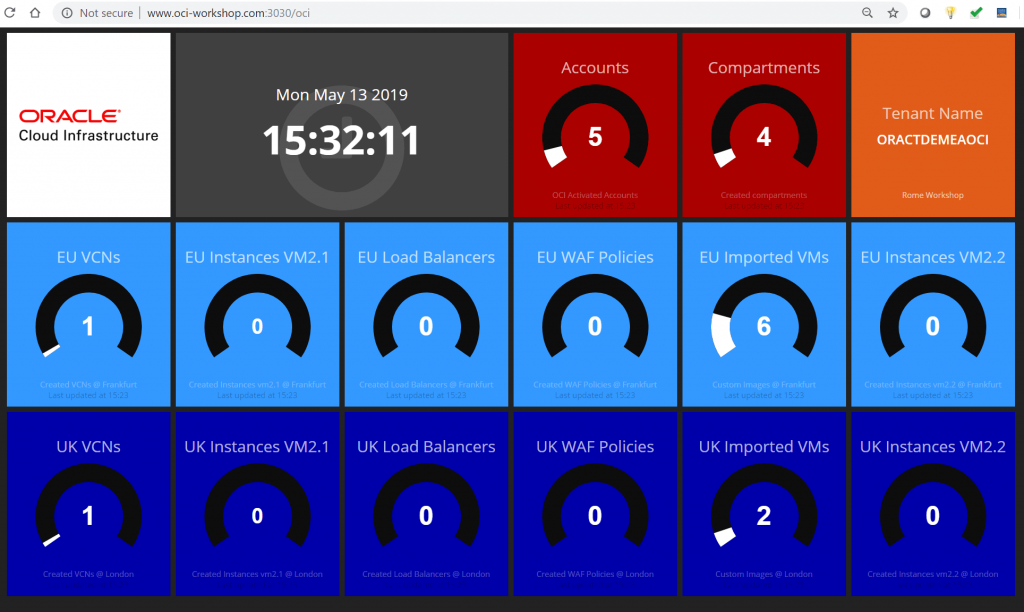
Who does not like a good (real-time) dashboard? Well I do! Last week I had to deliver a hands-on workshop for the Oracle Cloud Infrastructure, so why not make a cool dashboard to monitor the progress of the hands-on lab 🙂

It turned out not very difficult to do. I based my dashboard on the Smashing framework. This was simple to setup and design a nice looking dashboard page with. Just follow the 4 step installation instructions from the smashing website. The Smashing framework supports out-of-the-box some cool widgets and you can download many many more. I settled for mainly for the “meter” widget. This widget can show a number and charts this on a graph based on a min and max value. These widget can very easily be updated by a simple http call.
I wrote a simple python module to update the meter widget and to query OCI information. In my case mainly the sum of a certain object, like the amount of users, instances, load balancers, VCNs and more. I query this data using the OCI Python SDK.
The current dashboard was mainly designed specifically for my hands-on lab, but I will write some more modules in the future to cover more of the OCI elements.
You can find my code and sample smashing dashboard (oci.erb) here:
https://github.com/AnykeyNL/oci-smashing
Just update the smashing.py file with your Smashing Key and the URL of where smashing is running. Place the oci.erb file in your smashing dashboard directory and you should be all set.

Awesome! Thanks so much for sharing this.
RTeally cool. Which OS did you use? OL7 with RVM / Ruby installed first?
Thanks! I used ubuntu and just followed the easy 4 step install instructions from smashing 🙂
Pingback: OCI Dashboard with Smashing/Dashing and Kafka | Igfasouza.com